

A turbine power upgrade is only complete once you quantified the performance increase. Through our years of experience with our Vortex Generators we we developed and fine tuned a methodology which can reliably calculate the power increase after any kind of upgrade.

How does it work?
We use a power vs. power method. That means we directly compare the power output of a test turbine with the power output of an adjacent control turbine.
We consider two separate time periods. One period before the upgrade and one period after the upgrade. The difference between both periods reflects the effect of the performance upgrade.
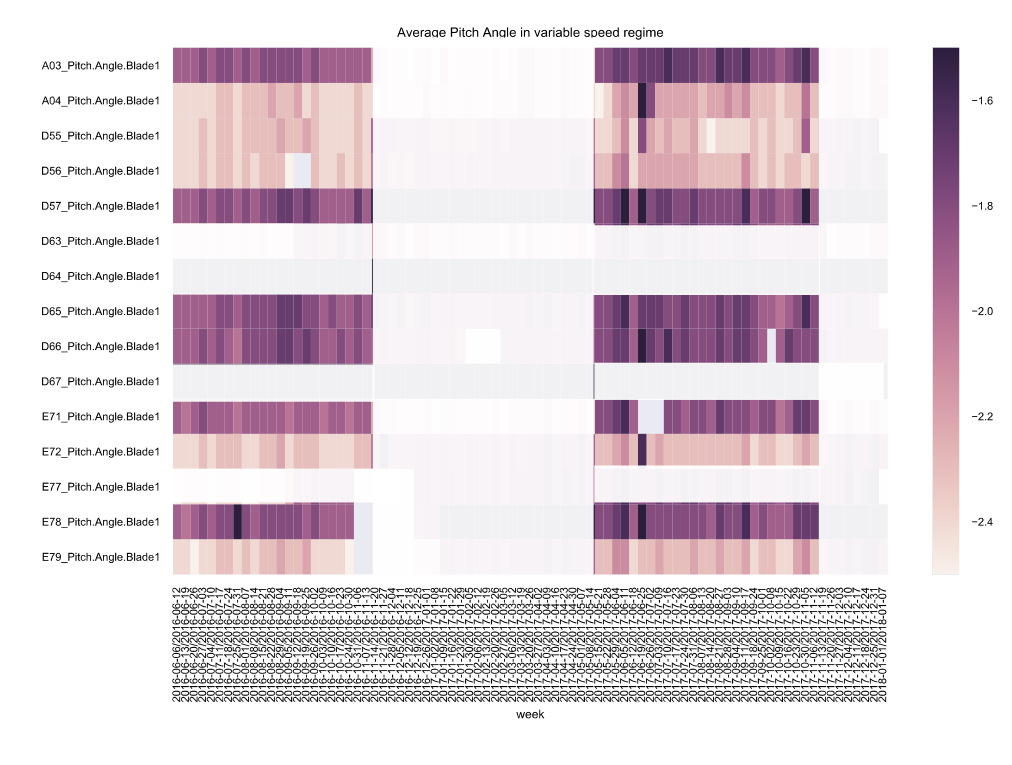
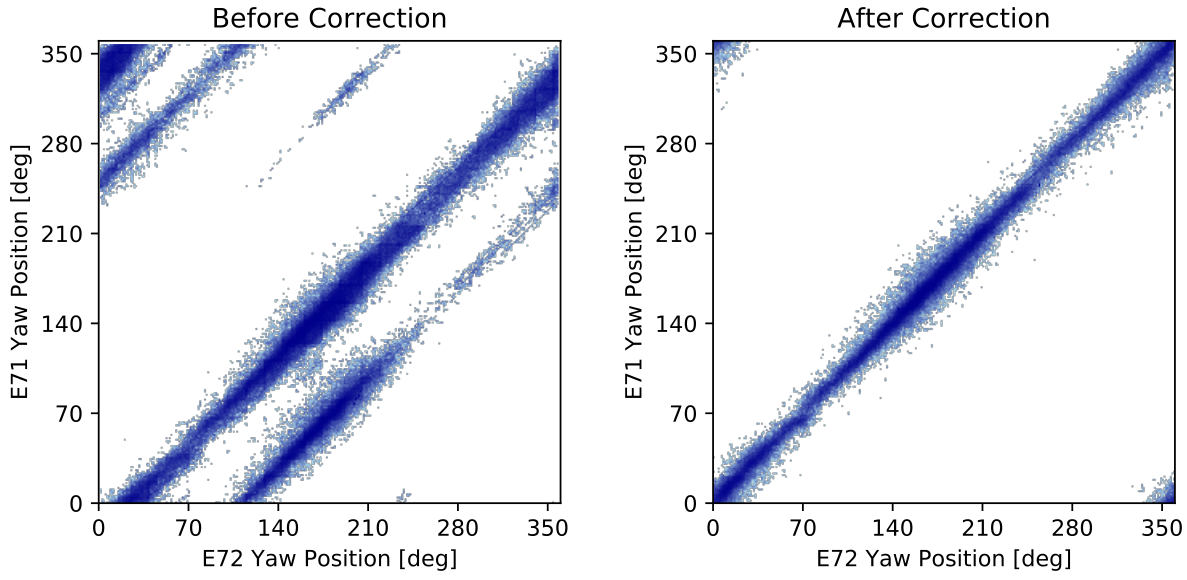
Sounds simple? Yes, but the devil is in the detail. One of the most important tasks of this statistical analysis is the data screening and data cleaning.
Big Data Analysis

unlocking the full potential: Big data analysis
One of the corner stones of our method is the use of high resolution data. We put a tremendous effort in maximizing the computational efficiency of our codes and use cutting edge tools like Python Dask.
We strongly believe that using the standard 10min SCADA data does not yield in a satisfying accuracy of the result. This is why we explore the full potential of high resolution SCADA data.

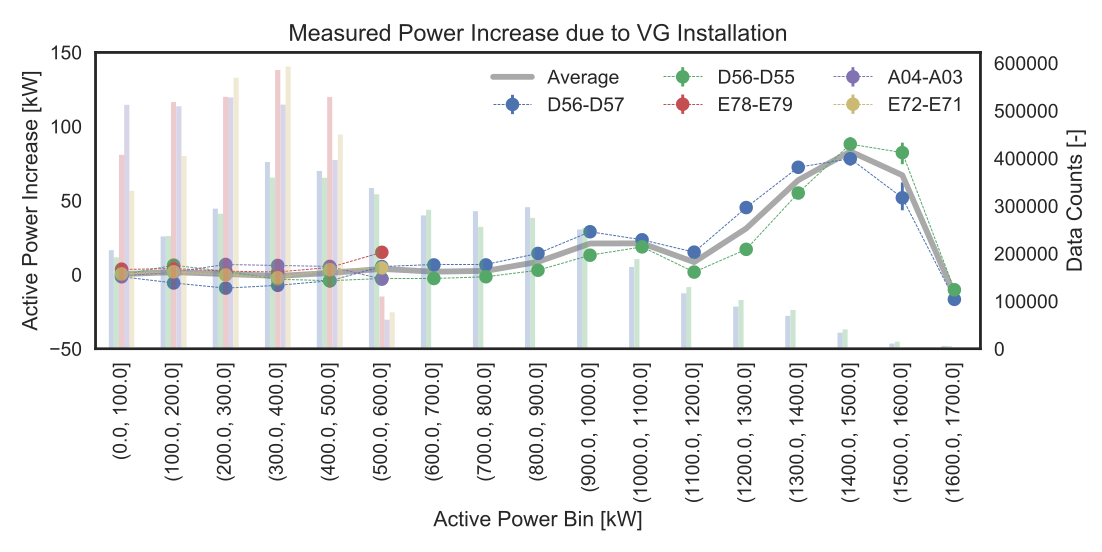
Comparison of a power vs. power calculation using 1sec data (left) and 10min data (right). The graph shows the power difference of a test turbine and a control turbine.
Other Key elements of the Method
- Use of high resolution SCADA data.
- No use of nacelle anemometer data.
- Use of multiple test pairs to reduce the overall variance of the result.
- Careful selection of turbine pairs in terms of in-flow conditions and operational history.
- Comparison of power outputs of two neighboring turbines, before and after the upgrade.
- Successfully reviewed by DNV-GL in several projects.
- Successfully validated against scientific TAMU method.
Power vs. Power
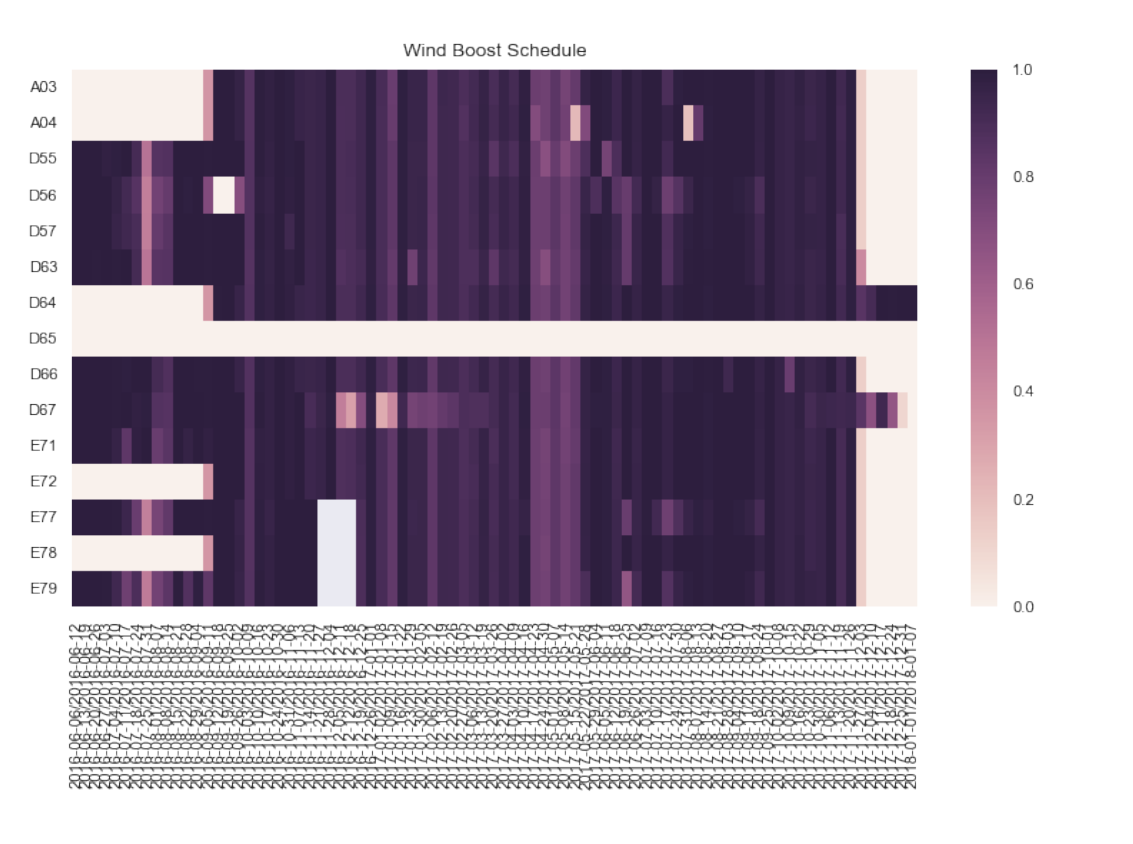
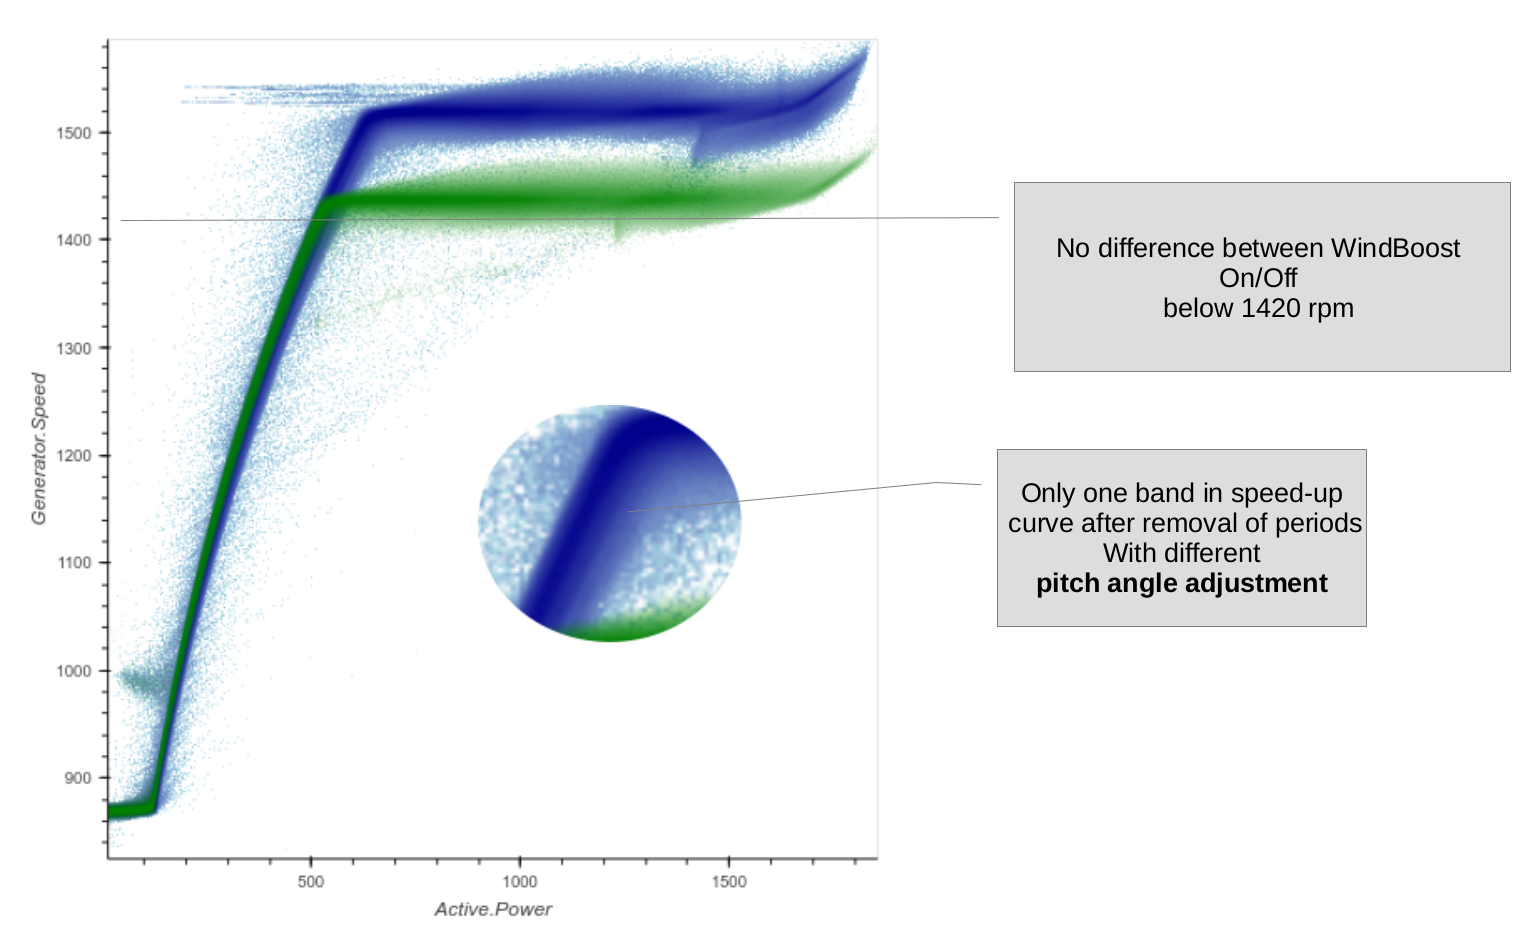
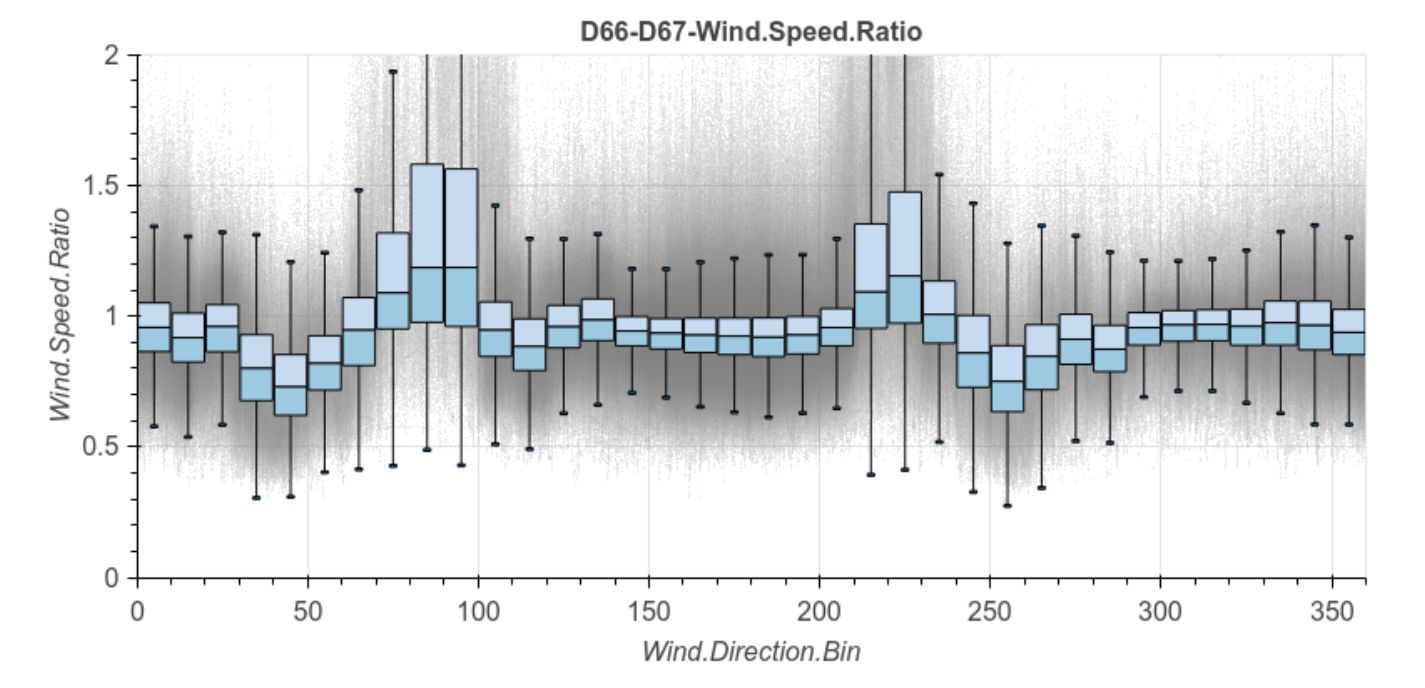
We directly compare the power output of two turbines. No relation to wind speed is being made. The underlying assumption is simple yet crucial: the turbines must see the same inflow and do the same thing at the same time. That is why we take so much care in verifying this assumption. A wind farm is a complex system. Changes to the wind turbines are frequently made. It is our task to identify these changes and establish a solid base for reference.
Comparison to other methods
- IEC power curves: IEC power curve measurements can only be done for a very few selected turbines, which fulfill the strict requirements of the IEC 61400-12-1. Therefore only a limited amount of test pairs can be installed and a met mast is required. Furthermore, the absolute of a power curve accuracy is not good enough.
- Nacelle power curves: The use of nacelle power curves is not recommended at all. Any performance upgrade will have an effect on the nacelle anemometer behind the rotor. This means any comparability before and after the upgrade is lost.
- LIDAR: LIDARs are still very expensive. Thus, they can only be installed on very few test turbines. In order to correctly account for seasonal influences, another LIDAR must be installed on a control turbine in parallel.
- iSpin: The iSpin offers a good alternative to the LIDAR, but still requires the installation of additional hardware.
Compared to the other performance evaluation methodologies, the power vs. power method is the most cost-effective way to verify the AEP gain of a performance upgrade.

